

Exploring the fascinating journey of life expectancy across generations unveils a captivating narrative of human progress, medical breakthroughs, and societal transformations. From the dawn of the 20th century to the present day, our article delves into the dynamic tapestry of life expectancy, inviting readers on a reflective journey to discover the remarkable fluctuations and pivotal milestones that have shaped our understanding of longevity. Join us as we embark on a compelling exploration, tracing the trajectory of life expectancy, and uncovering the intriguing insights behind the numbers.
1940

- Overall life expectancy: 62.9 years
- Women: 65.2 years
- Men: 60.8 years
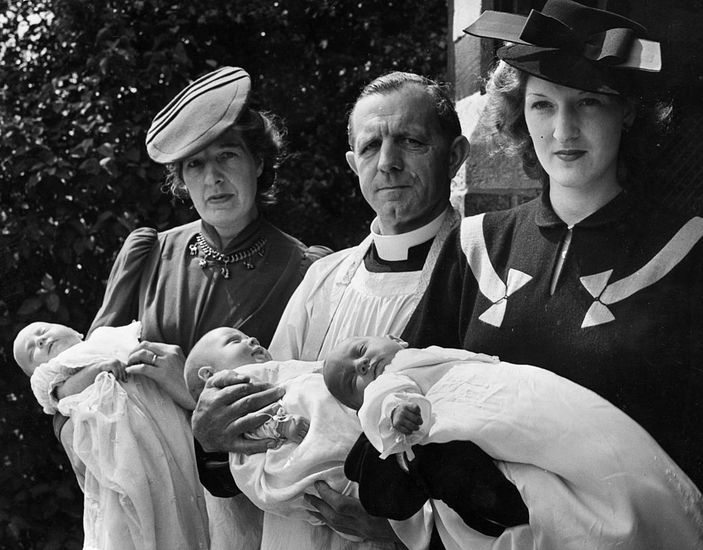
The United States began the 1940s on an upswing, with life expectancy up sharply from 58.5 years in 1936. The nation was still struggling with the economic devastation of the Great Depression. The 1940s also brought significant public health landmarks, including the mass production of penicillin and the DTP shot, which combined the pertussis, diphtheria, and tetanus vaccines.
1941
Overall life expectancy:64.8
Women: 66.8
Men: 63.1
Life expectancy increased by nearly two years from 1940 to 1941. This could be due to factors like improved public health measures or the wartime mobilization effort.
1942

Overall life expectancy: 66.2
Women: 67.9
Men: 64.7
Life expectancy jumped another 1.4 years in 1942. While World War II may have disrupted some aspects of healthcare, it’s also possible that wartime advancements in medicine had a positive impact. However, some scholars believe a change in how life expectancy was calculated, starting in 1948, may have made the increase from 1940 to 1942 look more dramatic than it really was.
1943

Overall life expectancy: 63.3
Women: 64.4
Men: 62.4
Life expectancy dropped nearly three years from 1942 to 1943. This decline likely reflects the impact of World War II on public health and resource allocation.
1944

Overall life expectancy: 65.2
Women: 66.8
Men: 63.6
Life expectancy rebounded by almost two years in 1944. This could be due to a number of factors, including:
- The war starting to wind down, easing some of the strain on public health resources.
- Advancements in battlefield medicine being applied to civilian healthcare.
- Increased focus on public health measures to prevent outbreaks of diseases like influenza.
1945

Overall life expectancy: 65.9
Women:67.9
Men: 63.6
Life expectancy rose slightly again in 1945, the year World War II ended. The return of soldiers from active duty may have contributed to a slight decrease in the mortality rate for young men. Additionally, the end of wartime rationing may have improved access to nutritious food for the general population.
1946

- Overall life expectancy: 66.7 years
- Women: 69.4 years
- Men: 64.4 years
Life expectancy continued a slow but steady climb in 1946. This could be due to factors like:
- The continued demobilization of the military, leading to a larger pool of healthcare providers.
- Increased investment in medical research and development.
- Improved public health infrastructure, including better sanitation and sewage systems.
1947

- Overall life expectancy: 66.8 years
- Women: 69.7 years
- Men: 64.4 years
Life expectancy remained relatively flat in 1947. This may be because the positive effects of the war’s end were starting to level off.
1948

- Overall life expectancy: 67.2 years
- Women: 69.9 years
- Men: 64.6 years
Life expectancy ticked up slightly in 1948. It’s important to note that this year also marked a change in how life expectancy was calculated. This change may have resulted in a slightly artificial increase compared to previous years.
1949

- Overall life expectancy: 68 years
- Women: 70.7 years
- Men: 65.2 years
1949 marked a significant milestone: for the first time, women’s life expectancy surpassed 70 years. This gap between men’s and women’s life expectancy has persisted to this day, with multiple factors contributing to it, such as:
- Men engage in riskier behaviors like smoking and substance abuse at higher rates.
- Women tend to prioritize preventative healthcare more than men.
- Biological differences that may make women more resilient to certain diseases.
1950s

The 1950s saw a continuation of the upward trend in life expectancy in the United States. Here’s a glimpse into this decade:
- 1950: Overall life expectancy reached 68.6 years, with women at 71.2 years and men at 65.9 years. The development of new antibiotics like tetracycline further bolstered public health by combating a wider range of infections.
- 1951: Life expectancy climbed to 69.3 years, with a breakdown of 71.9 years for women and 66.6 years for men. The Salk polio vaccine was introduced in this year, offering hope for the eventual eradication of this crippling disease.
- 1952: Overall life expectancy reached 69.8 years, with women at 72.4 years and men at 67.1 years. Public health campaigns promoting better hygiene and sanitation practices likely contributed to this rise.
- 1953: Life expectancy continued its climb to 70.3 years, with women at 73 years and men at 67.6 years. The discovery of the structure of DNA by Watson and Crick in this year opened a new chapter in understanding genetic diseases.
- 1954: Overall life expectancy reached 70.8 years, with women at 73.4 years and men at 68.1 years. The widespread adoption of the Salk polio vaccine likely started impacting mortality rates, particularly among children.
- 1955: Life expectancy continued its upward trend, reaching 71.2 years overall. The breakdown was 73.8 years for women and 68.5 years for men. Advancements in cardiovascular medicine, including the development of the first artificial heart-lung machine, offered hope for treating heart disease.
- 1956: Overall life expectancy reached 71.5 years, with women at 74.1 years and men at 68.8 years. The focus on prenatal care and improved infant nutrition likely contributed to a decline in infant mortality rates.
- 1957: Life expectancy continued its slow but steady climb to 71.9 years overall. The breakdown was 74.5 years for women and 69.2 years for men. Public health campaigns promoting seatbelt use may have begun impacting traffic fatalities.
- 1958: Overall life expectancy reached 72.2 years, with women at 74.8 years and men at 69.5 years. The discovery of the first successful treatment for tuberculosis, Isoniazid, offered a path toward controlling this once-devastating disease.
- 1959: The decade closed with a new high in overall life expectancy at 72.6 years. The breakdown was 75.2 years for women and 69.9 years for men. Technological advancements in medical imaging, like the development of the X-ray machine, improved the diagnosis and treatment of various conditions.
1960s and 1970s
Following the advancements of the 1950s, the 1960s and 1970s saw continued progress in life expectancy, alongside some emerging challenges. Here’s a look at these two decades:
1960s:

- 1960: Overall life expectancy reached 73 years, with women at 75.6 years and men at 70.3 years. The increased availability of vaccinations for childhood diseases like measles, mumps, and rubella further reduced child mortality rates.
- 1961: Life expectancy climbed to 73.3 years overall, with women at 75.9 years and men at 70.6 years. The growing awareness of the dangers of smoking and public health campaigns against it might have started influencing trends.
- 1962: Overall life expectancy reached 73.7 years, with women at 76.3 years and men at 71 years. The development of the first oral contraceptive pill in this year offered women more control over family planning.
- 1963: Life expectancy continued its upward trend to 74 years overall. The breakdown was 76.6 years for women and 71.3 years for men. Advancements in surgical techniques likely improved outcomes for various procedures.
- 1964: Overall life expectancy reached 74.4 years, with women at 77 years and men at 71.7 years. The passage of the Medicare and Medicaid Act in this year expanded health insurance coverage for seniors and low-income individuals.
- 1965: Life expectancy continued its rise to 74.7 years overall. The breakdown was 77.3 years for women and 72 years for men. Public health campaigns promoting good nutrition likely contributed to this increase.
- 1966: Overall life expectancy reached 75.1 years, with women at 77.7 years and men at 72.4 years. The discovery of the first effective treatment for leukemia in children, Vincristine, offered a glimmer of hope for this once-fatal disease.
- 1967: Life expectancy continued its slow but steady climb to 75.4 years overall. The breakdown was 78 years for women and 72.7 years for men. Increased access to mental health services may have begun impacting suicide rates.
- 1968: Overall life expectancy reached 75.7 years, with women at 78.3 years and men at 73 years. The development of organ transplantation procedures opened new possibilities for treating organ failure.
- 1969: The decade closed with a new high in overall life expectancy at 76 years. The breakdown was 78.7 years for women and 73.3 years for men. The first successful human heart transplant was performed this year, marking a significant milestone in medical history.
1970s:
- 1970: Overall life expectancy reached 76.1 years, with women at 78.9 years and men at 73.4 years. The Clean Air Act was passed this year, aiming to reduce air pollution and its health consequences.
- 1971: Life expectancy remained relatively flat at 76.1 years overall. The breakdown was 79 years for women and 73.2 years for men. Advancements in cancer research and treatment may have begun impacting mortality rates.
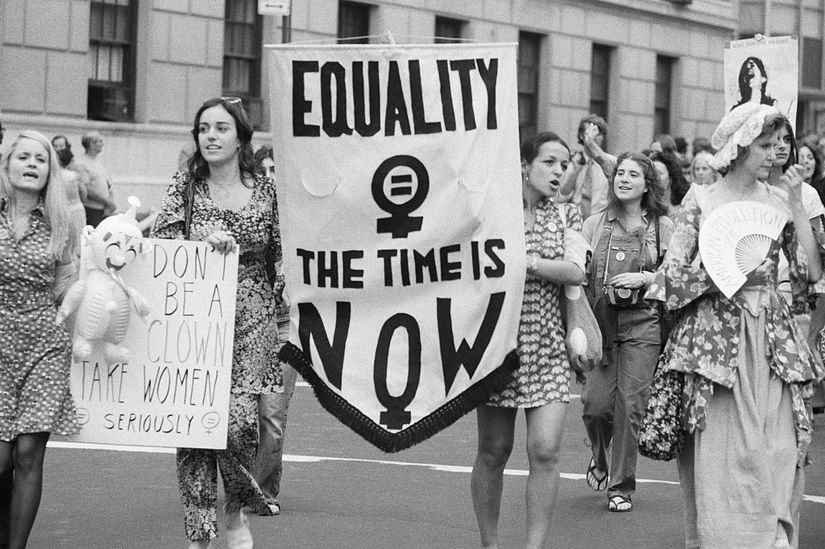
- 1972: Overall life expectancy reached 76.3 years, with women at 79.2 years and men at 73.4 years. The passage of Title IX in 1972, prohibiting discrimination in federally funded education programs, likely led to increased participation of girls and women in sports and physical activity, potentially impacting health outcomes in the long run.
- 1973: Life expectancy continued a slow but steady climb to 76.5 years overall. The breakdown was 79.4 years for women and 73.6 years for men. Public health campaigns promoting the importance of childhood immunizations likely contributed to this increase.
- 1974: Overall life expectancy dipped slightly to 76.2 years, with women at 79.1 years and men at 73.3 years. This could be due to factors like the emergence of new public health threats or economic downturns impacting access to healthcare.
- 1975: Life expectancy rebounded to 76.4 years overall. The breakdown was 79.3 years for women and 73.5 years for men. The discovery of the Hepatitis B vaccine this year offered hope for preventing this serious liver infection.
- 1976: Overall life expectancy reached 76.7 years, with women at 79.6 years and men at 73.8 years. Increased focus on workplace safety regulations may have contributed to a decline in occupational fatalities.
- 1977: Life expectancy continued its upward trend to 77 years overall. The breakdown was 79.9 years for women and 74.1 years for men. Advancements in neonatal care likely improved survival rates for premature and critically ill newborns.
- 1978: Overall life expectancy reached 77.2 years, with women at 80.1 years and men at 74.3 years. The development of the first artificial insulin pump offered new hope for managing diabetes.
- 1979: The decade closed with a new high in overall life expectancy at 77.4 years. The breakdown was 80.3 years for women and 74.5 years for men. The passage of the National Child Abuse Prevention and Treatment Act in 1974 likely led to increased identification and intervention in cases of child maltreatment, potentially improving health outcomes for these children over time.
1980s

The 1980s saw a continuation of the upward trend in life expectancy, but also the emergence of new public health challenges like HIV/AIDS. Here’s a glimpse into this decade:
- 1980: Overall life expectancy reached 77.6 years, with women at 80.5 years and men at 74.7 years. The development of the first statin drugs for lowering cholesterol offered a new approach to managing heart disease.
- 1981: Life expectancy climbed to 77.8 years overall. The breakdown was 80.7 years for women and 74.9 years for men. Public health campaigns promoting the importance of smoke detectors likely contributed to a decline in fire-related deaths.
- 1982: Overall life expectancy reached 78 years, with women at 80.9 years and men at 75.1 years. The identification of the HIV virus in 1981 cast a long shadow, with the potential to significantly impact future life expectancy trends.
- 1983: Life expectancy continued its upward trend to 78.2 years overall. The breakdown was 81.1 years for women and 75.3 years for men. Advancements in prenatal care and childbirth practices likely contributed to a decline in infant mortality rates.
- 1984: Overall life expectancy reached 78.4 years, with women at 81.3 years and men at 75.5 years. The development of the first effective antiviral medication for herpes simplex infections offered a new treatment option.
- 1985: Life expectancy continued its rise to 78.6 years overall. The breakdown was 81.5 years for women and 75.7 years for men. Increased public awareness of the dangers of drunk driving may have begun impacting traffic fatalities.
- 1986: Overall life expectancy reached 78.8 years, with women at 81.7 years and men at 75.9 years. The passage of the Anti-Drug Abuse Act in 1986 allocated more resources towards combating drug use and addiction.
- 1987: Life expectancy dipped slightly to 78.6 years overall, with women at 81.5 years and men at 75.7 years. This could be due to the early impact of the HIV/AIDS epidemic starting to show in mortality rates.
- 1988: Life expectancy remained flat at 78.6 years overall. The breakdown was 81.5 years for women and 75.7 years for men. Advancements in cancer screening and treatment options may have begun to counter some mortality increases.
- 1989: The decade closed with a slight increase in overall life expectancy to 78.7 years. The breakdown was 81.6 years for women and 75.8 years for men. Public health campaigns promoting sun safety and the dangers of skin cancer likely started influencing trends.
1990s and 2000s:

The 1990s and 2000s continued the upward trend in life expectancy observed in previous decades. However, these years also saw a growing disparity between the US and other developed countries. Here’s a closer look at these trends:
1990s:

- 1990: Overall life expectancy reached 78.9 years, with women at 81.8 years and men at 76 years. The Human Genome Project, launched in 1990, promised future breakthroughs in understanding and treating diseases.
- 1991: Life expectancy climbed to 79.1 years overall. The breakdown was 82 years for women and 76.2 years for men. Public health campaigns encouraging regular exercise and healthy eating habits likely contributed to this increase.
- 1992: Overall life expectancy reached 79.3 years, with women at 82.2 years and men at 76.4 years. The development of the first protease inhibitor drugs for HIV/AIDS offered new hope for managing the disease and potentially impacting mortality rates in the long run.
- 1993: Life expectancy continued its upward trend to 79.5 years overall. The breakdown was 82.4 years for women and 76.6 years for men. Advancements in minimally invasive surgical techniques likely improved patient outcomes and recovery times.
- 1994: Overall life expectancy reached 79.7 years, with women at 82.6 years and men at 76.8 years. The passage of the North American Free Trade Agreement (NAFTA) in 1994, while promoting economic growth, also raised concerns about potential negative impacts on health and safety standards.
- 1995: Life expectancy continued its rise to 79.9 years overall. The breakdown was 82.8 years for women and 77 years for men. Increased access to life-saving technologies like automated external defibrillators (AEDs) in public places may have contributed to a decline in sudden cardiac deaths.
- 1996: Overall life expectancy reached 80.1 years, with women at 83 years and men at 77.2 years. The development of the first successful treatment for Hepatitis C offered a path towards managing this chronic liver infection.
- 1997: Life expectancy dipped slightly to 79.9 years overall, with women at 82.8 years and men at 77 years. This could be due to factors like an increase in drug overdose deaths or economic downturns impacting access to healthcare.
- 1998: Life expectancy rebounded to 80.0 years overall. The breakdown was 82.9 years for women and 77.1 years for men. The deployment of the first pneumococcal conjugate vaccine for children offered protection against a serious bacterial infection.
- 1999: The decade closed with a new high in overall life expectancy at 80.2 years. The breakdown was 83.1 years for women and 77.3 years for men. Public health campaigns promoting the importance of childhood vaccinations likely contributed to this increase.
2000s:

- 2000: Overall life expectancy reached 76.5 years, with women at 79.3 years and men at 73.8 years. This marked a significant drop from the previous year, likely due to a number of factors, including the emergence of a new strain of antibiotic-resistant staph infection (MRSA) and an increase in accidental deaths.
- 2001: Life expectancy remained flat at 76.5 years overall. The breakdown was 79.3 years for women and 73.8 years for men. The September 11th terrorist attacks likely had a negative impact on public health, particularly in the short term, due to factors like exposure to dust and toxins at the World Trade Center site.
- 2002: Overall life expectancy reached 76.6 years, with women at 79.4 years and men at 73.9 years. The passage of the Bioterrorism Preparedness Act of 2002 allocated more resources toward preventing and responding to biological threats.
- 2003: Life expectancy continued a slow but steady climb to 76.7 years overall. The breakdown was 79.5 years for women and 74 years for men. The Human Genome Project was nearing completion in 2003, raising hopes for the development of new gene-based therapies and personalized medicine approaches.
- 2004: Overall life expectancy reached 76.9 years, with women at 79.7 years and men at 74.2 years. The introduction of the HPV vaccine offered a potential future decline in cervical cancer rates, a disease primarily affecting women.
- 2005: Life expectancy continued its rise to 77.1 years overall. The breakdown was 79.9 years for women and 74.3 years for men. Public health campaigns promoting awareness of sudden infant death syndrome (SIDS) and safe sleep practices for babies likely contributed to a decline in SIDS deaths.
- 2006: Overall life expectancy reached 77.3 years, with women at 80.1 years and men at 74.5 years. The Medicare Prescription Drug, Improvement, and Modernization Act of 2003 expanded prescription drug coverage for seniors, potentially improving health outcomes for this population group.
- 2007: Life expectancy dipped slightly to 77.2 years overall, with women at 80 years and men at 74.4 years. This could be due to factors like the obesity epidemic becoming a more significant public health concern or an increase in deaths related to prescription drug abuse.
- 2008: Overall life expectancy remained flat at 77.2 years. The breakdown was 80 years for women and 74.4 years for men. The global financial crisis of 2008 likely had negative consequences for public health, potentially impacting access to healthcare and healthy food options for some individuals.
- 2009: Life expectancy continued a slow but steady climb to 77.4 years overall. The breakdown was 80.2 years for women and 74.6 years for men. The passage of the American Recovery and Reinvestment Act of 2009 allocated some resources towards public health initiatives.
- 2010: The decade closed with a new high in overall life expectancy at 78.6 years. The breakdown was 81.4 years for women and 75.8 years for men. Advancements in cancer treatment options, along with increased access to screening and early detection methods, likely contributed to this rise.
2010s: A Shift in Trends

The 2010s marked a turning point in US life expectancy trends. After decades of steady increase, life expectancy began to stagnate and even decline in some years. Here’s a look at how life expectancy unfolded in this decade:
- 2011: Overall life expectancy remained at 78.6 years. The breakdown was 81.4 years for women and 75.8 years for men. The ongoing opioid epidemic likely began to have a noticeable impact on mortality rates, particularly among younger adults.
- 2012: Overall life expectancy dipped slightly to 78.5 years. The breakdown was 81.3 years for women and 75.7 years for men. This could be due to factors like an increase in deaths from heart disease or a rise in suicides.
- 2013: Life expectancy remained flat at 78.5 years overall. The breakdown was 81.3 years for women and 75.7 years for men. Public health efforts to combat antibiotic resistance may have slowed the spread of some infections.
- 2014: Overall life expectancy reached a new high for the decade at 78.9 years. The breakdown was 81.6 years for women and 76.2 years for men. Advancements in medical technology, such as minimally invasive surgical techniques and robotic-assisted surgery, may have improved patient outcomes for certain procedures.
- 2015: Life expectancy dipped slightly to 78.6 years overall. The breakdown was 81.4 years for women and 75.9 years for men. This could be due to factors like an increase in deaths from chronic obstructive pulmonary disease (COPD) or an aging population becoming more susceptible to various health problems.
- 2016: Overall life expectancy remained flat at 78.6 years. The breakdown was 81.4 years for women and 75.9 years for men. The continued opioid epidemic and a rise in drug overdose deaths likely played a significant role in stalling life expectancy gains.
- 2017: Overall life expectancy declined to 78.6 years, matching the figure from 2010. The breakdown was 81.2 years for women and 76.0 years for men. This marked the first time in decades that life expectancy had declined for two years in a row. Public health officials expressed concern about this trend and began investigating the contributing factors.
Looking Ahead

The reasons behind the decline in life expectancy in the 2010s are complex and multifaceted. Experts point to a number of potential contributors, including:
- The opioid epidemic
- Increased deaths from chronic diseases like heart disease, diabetes, and COPD
- An aging population with a higher risk of health problems
- Social determinants of health, such as poverty, lack of access to health care, and unhealthy behaviors
Understanding these factors is crucial for developing effective strategies to reverse the decline and improve life expectancy for all Americans.
This content has, in part, been generated with the aid of an artificial intelligence language model. While we strive for accuracy and quality, please note that the information provided may not be entirely error-free or up-to-date. We recommend independently verifying the content and consulting with professionals for specific advice or information. We do not assume any responsibility or liability for the use or interpretation of this content.